The following is a detailed explanation of the work done to produce my public player comparison data visualization tool. If you wish to see the visualization in action it can be found at the following link, but I wholeheartedly encourage you to continue reading to understand exactly what you’re looking at:
https://public.tableau.com/profile/owen.kewell#!/vizhome/PlayerSimilarityTool/PlayerSimilarityTool
NHL players are in direct competition with hundreds of their peers. The game-after-game grind of professional hockey tests these individuals on their ability to both generate and suppress offense. As a player, it’s almost guaranteed that some of your competitors will be better than you on one or both sides of the puck. Similarly, you’re likely to be better than plenty of others. It’s also likely that there are a handful of players league-wide whose talent levels are right around your own.
The NHL is a big league. In the 2017-18 season, 759 different skaters suited up for at least 10 games, including 492 forwards and 267 defensemen. In such a deep league, each player should be statistically similar to at least a handful of their peers. But how to find these league-wide comparables?
Enter a bit of helpful data science. Thanks to something called Euclidean distance, we can systemically identify a player’s closest comparables around the league. Let’s start with a look at Anze Kopitar.

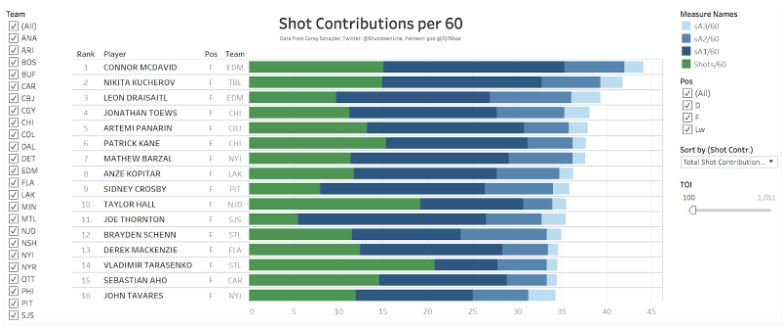
Anze Kopitar's closest offensive and defensive comparables around the league
The above graphic is a screenshot of my visualization tool.
With the single input of a player’s name, the tool displays the NHL players who represent the five closest offensive and defensive comparables. It also shows an estimate of the strength of this relationship in the form of a similarity percentage.
The visualization is intuitive to read. Kopitar’s closest offensive comparable is Voracek, followed by Backstrom, Kane, Granlund and Bailey. His closest defensive comparables are Couturier, Frolik, Backlund, Wheeler, and Jordan Staal. All relevant similarity percentages are included as well.
The skeptics among you might be asking where these results come from. Great question.
A Brief Word on Distance
The idea of distance, specifically Euclidean distance, is crucial to the analysis that I’ve done. Euclidean distance is a fancy name for the length of the straight line that connects two different points of data. You may not have known it, but it’s possible that you used Euclidean distance during high school math to find the distance between two points in (X,Y) cartesian space.
Now think of any two points existing in three-dimensional space. If we know the details of these points then we’re able to calculate the length of the theoretical line that would connect them, or their Euclidean distance. Essentially, we can measure how close the data points are to each other.
Thanks to the power of mathematics, we’re not constrained to using data points with three or fewer dimensions. Despite being unable to picture the higher dimensions, we've developed techniques for measuring distance even as we increase the complexity of the input data.
Applying Distance to Hockey
Hockey is excellent at producing complex data points. Each NHL game produces an abundance of data for all players involved. This data can, in turn, be used to construct a robust statistical profile for each player.
As you might have guessed, we can calculate the distance between any two of these players. A relatively short distance between a pair would tell us that the players are similar, while a relatively long distance would indicate that they are not similar at all. We can use these distance measures to identify meaningful player comparables, thereby answering our original question.
I set out to do this for the NHL in its current state.
Data
First, I had to determine which player statistics to include in my analysis. Fortunately, the excellent Rob Vollman publishes a data set on his website that features hundreds of statistics combed from multiple sources, including Corsica Hockey (http://corsica.hockey/), Natural Stat Trick (https://naturalstattrick.com) and NHL.com. The downloadable data set can be found here: http://www.hockeyabstract.com/testimonials. From this set, I identified the statistics that I considered to be most important in measuring a player’s offensive and defensive impacts. Let’s talk about offense first.

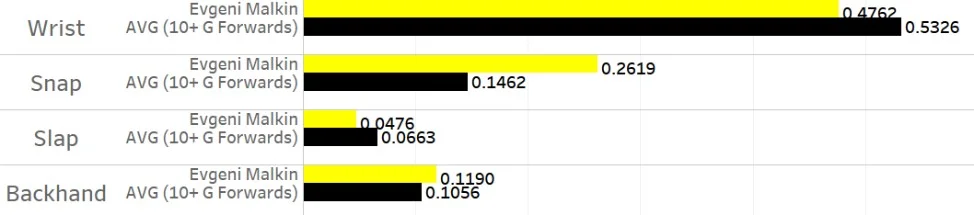
List of offensive similarity input statistics
I decided to base offensive similarity on the above 27 statistics. I’ve grouped them into five categories for illustrative purposes. The profile includes 15 even-strength stats, 7 power-play stats, and 3 short-handed stats, plus 2 qualifiers. This 15-7-3 distribution across game states reflects my view of the relative importance of each state in assessing offensive competence. Thanks to the scope of these statistical measures, we can construct a sophisticated profile for each player detailing exactly how they produce offense. I consider this offensive sophistication to be a strength of the model.
While most of the above statistics should be self-explanatory, some clarification is needed for others. ‘Pass’ is an estimate of a player’s passes that lead to a teammate’s shot attempt. ‘IPP%’ is short for ‘Individual Points Percentage’, which refers to the proportion of a team’s goals scored with a player on the ice where that player registers a point. Most stats are expressed as /60 rates to provide more meaningful comparisons.
You might have noticed that I double-counted production at even-strength by including both raw scoring counts and their /60 equivalent. This was done intentionally to give more weight to offensive production, as I believe these metrics to be more important than most, if not all, of the other statistics that I included. I wanted my model to reflect this belief. Double-counting provides a practical way to accomplish this without skewing the model’s results too heavily, as production statistics still represent less than 40% of the model’s input data.
Now, let's look at defense.

List of defensive similarity input statistics
Defensive statistical profiles were built using the above 19 statistics. This includes 15 even-strength stats, 2 short-handed stats, and the same 2 qualifiers. Once again, even-strength defensive results are given greater weight than their special teams equivalents.
Sadly, hockey remains limited in its ability to produce statistical measurements of individual defensive talent. It’s hard to quantify events that don’t happen, and even harder to properly identify the individuals responsible for the lack of these events. Despite this, we still have access to a number of useful statistics. We can measure the rates at which opposing players record offensive events, such as shot attempts and scoring chances. We can also examine expected goals against, which gives us a sense of a player’s ability to suppress quality scoring chances. Additionally, we can measure the rates at which a player records defense-focused micro-events like shot blocks and giveaways. The defensive profile built by combining these stats is less sophisticated than its offensive counterpart due to the limited scope of its components, but the profile remains at least somewhat useful for comparison purposes.
Methodology
For every NHLer to play 10 or more games in 2017-18, I took a weighted average of their statistics across the past two seasons. I decided to weight the 2017-18 season at 60% and the 2016-17 season at 40%. If the player did not play in 2016-17, then their 2017-18 statistics were given a weight of 100%. These weights represent a subjective choice made to increase the relative importance of the data set’s more recent season.
Having taken this weighted average, I constructed two data sets; one for offense and the other for defense. I imported these spreadsheets into Pandas, which is a Python package designed to perform data science tasks. I then faced a dilemma. Distance is a raw quantitative measure and is therefore sensitive to its data’s magnitude. For example, the number of ‘Games Played’ ranges from 10-82, but Individual Points Percentage (IPP%) maxes out at 1. This magnitude issue would skew distance calculations unless properly accounted for.
To solve this problem, I proportionally scaled all data to range from 0 to 1. 0 would be given to the player who achieved the stat’s lowest rate league-wide, and 1 to the player who achieved the highest. A player whose stat was exactly halfway between the two extremes would be given 0.5, and so on. This exercise in standardization resulted in the model giving equal consideration to each of its input statistics, which was the desired outcome.
I then wrote and executed code that calculated the distance between a given player and all others around the league who share their position. This distance list was then sorted to identify the other players who were closest, and therefore most comparable, to the original input player. This was done for both offensive and defensive similarity, and then repeated for all NHL players.
This process generated a list of offensive and defensive comparables for every player in the league. I consider these lists to be the true value, and certainly the main attraction, of my visualization tool.
Not satisfied with simply displaying the list of comparable players, I wanted to contextualize the distance calculations by transforming them into a measure that was more intuitively meaningful and easier to communicate. To do this, I created a similarity percent measure with a simple formula.

In the above formula, A is the input player, B is their comparable that we’re examining, and C is the player least similar to A league-wide. For example, if A->B were to have a distance of 1 and A->C a distance of 5, then the A->B similarity would be 1 - (1/5), or 80%. Similarity percentages in the final visualization were calculated using this methodology and provide an estimate of the degree to which two players are comparable.
Limitations
While I wholeheartedly believe that this tool is useful, it is far from perfect. Due to a lack of statistics that measure individual defensive events, the accuracy of defensive comparisons remains the largest limitation. I hope that the arrival of tracking data facilitates our ability to measure pass interceptions, gap control, lane coverage, forced errors, and other individual defensive micro-events. Until we have this data, however, we must rely on rates that track on-ice suppression of the opposing team’s offense. On-ice statistics tend to be similar for players who play together often, which causes the model to overstate defensive similarity between common linemates. For example, Josh Bailey rates as John Tavares’ closest defensive comparable, which doesn’t really pass the sniff test. For this reason, I believe that the offensive comparisons are more relevant and meaningful than their defensive counterparts.
Use Scenarios
This tool’s primary use is to provide a league-wide talent barometer. Personally, I enjoy using the visualization tool to assess relative value of players involved in trades and contract signings around the league. Lists of comparable players give us a common frame through which we can inform our understanding of an individual's hockey abilities. Plus, they’re fun. Everyone loves comparables.
The results are not meant to advise, but rather to entertain. The visualization represents little more than a point-in-time snapshot of a player’s standing around the league. As soon as the 2018-19 season begins, the tool will lose relevance until I re-run the model with data from the new season. Additionally, I should explicitly mention that the tool does not have any known predictive properties.
If you have any questions or comments about this or any of my other work, please feel free to reach out to me. Twitter (@owenkewell) will be my primary platform for releasing all future analytics and visualization work, and so I encourage you to stay up to date with me through this medium.
Cover photo credited to Jae C. Hong — Associated Press