
By Josh Margles, data visualization by Anthony Turgelis
A run batted in or RBI occurs when a player hits the ball and a runner scores on the play. RBIs are often criticized because they are largely dependent on how many plate opportunities the hitter gets with runners on base. Most analytics experts have dismissed RBIs as a dated stat, but many baseball insiders still claim that they have some relevance. A player that hits in the middle of the order will get more RBI chances than a player that hits leadoff. Also, a player on a high scoring team that puts lots of players on base will get more chances than a player in a bad lineup - who usually hits with the bases empty.
Taking the stats from hitters over the past three seasons and using a lasso regression technique in the programming model R, we created a model that predicts how many RBIs a player should get based off his amount of singles, doubles, triples and homeruns. Obviously, the more home runs a player hits, the more RBIs he will get as even if the bases are empty, one is guaranteed. While singles are important, it is much harder to get an RBI with a single because a runner will most likely have to be in scoring position.
I took the expected RBIs and compared them to how many actual RBIs the player got and compared the difference between them for every player in 2018 with at least 450 PA. This gives a look at some players that were hurt by their situations, while also showing how their RBIs increase due to the position of their teammates.
Here are the players that had the biggest differences in 2018:


Mike Trout
Seven-time MLB All-star Mike Trout, has been putting up incredible numbers his entire career. Unfortunately, he has largely been surrounded by a mediocre supporting cast. Part of the reason why his RBIs are down, is because pitchers can pitch around him with runners on without worrying about the hitter behind him. He had 25 intentional walks and 122 total walks, which stands as the most and second most in the MLB respectively.
Another reason why his RBI numbers are down is due to the lack of runners on base when Trout came up. Trout hit .325 with runners on and .346 with runners in scoring position, but there weren’t a lot of opportunities. His average, slugging percentage, and OPS all increase with runners on. Among non-leadoff hitters, only DJ LeMahieu faced a higher percentage of pitches with no runners on. This shows that in today’s game, it is hard to drive runners in when there are no runners on base.
Lorenzo Cain
Much of Cain’s lack of RBIs has do to with the fact that he hits leadoff. He spends a lot of his at bats with no runners on base. Despite this fact, it is unlikely that a player with 10 homeruns, 25 doubles and 129 singles would only have 38 RBIs.
Cain hit all but one of his home runs with no one on, and had over 65 percent of his hits come with no one on. He scored a lot of runs but did not have many opportunities to drive them in.
Xander Bogaerts
Bogaerts’ RBI total is mainly a product with hitting behind Mookie Betts, JD Martinez and Andrew Benintendi. His numbers only go up slightly with runners on which means his production is more a product of his environment. For example, Bogaerts faced the fifth most pitches with runners in scoring position this season and had the ninth most plate appearances.
Another reason why his numbers are so high is that he had the most extra base hits with runners in scoring position. Some people will argue that this is Bogaerts being “clutch” but all it means is that his extra base hits happened to come when runners were on.
Nick Markakis
Markakis benefited greatly from hitting behind Ronald Acuna Jr., Ozzie Albies and Freddie Freeman for most of the season. Markakis faced the most pitches with runners on base and runners in scoring position this season. He also faced the most pitches and had the most plate appearances with runners on base.
While his numbers improved with men on, it was not a huge jump. With so many opportunities coming with runners on, Markakis was in a great position to drive in teammates throughout the season. In such a stacked lineup, it was easy for Markakis to pile up RBIs based on his opportunities.
What we can see from these numbers is that many players can benefit or be hurt by their surroundings. While some players like JD Martinez and Khris Davis have high totals due to their home run totals, others are due to their teammates. RBIs can still be used to determine how many runs a player drove in, but it must be looked at whether the player truly earned each RBI.
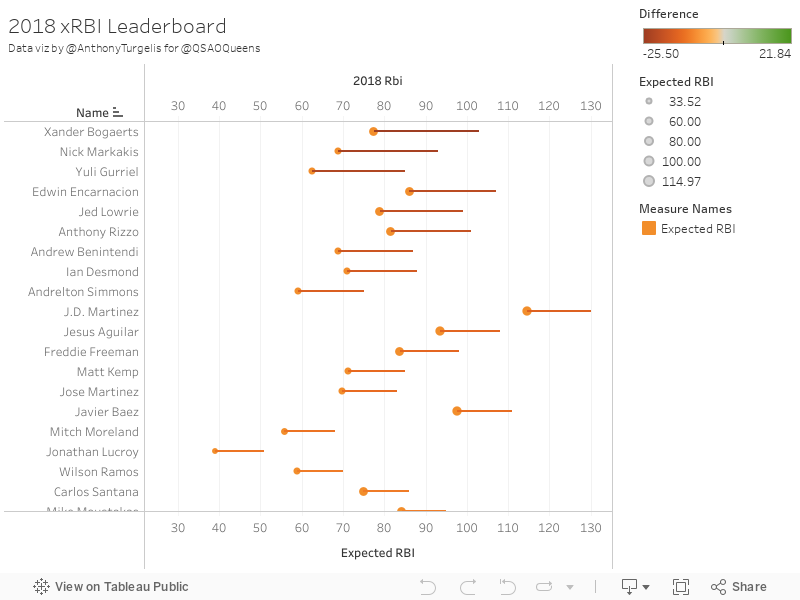
xRBI Leaderboard
To view the xRBI of all players with 450+ PA in the 2018 season, refer to the interactive visualization below. The orange dot indicates the xRBI value, while the bar indicates the difference between their actual RBIs. A red line indicates they benefitted from their situation, while a green line means they likely should have had more RBIs but were penalized by their situation. To sort by RBI, xRBI, or the difference between the two, right click on “Name” and select your preferred view.
Stats from FanGraphs.com, Baseball-Reference.com and baseballsavant.com