
How early is too early when it comes to getting excited about a player or teams’ success early on in the season? While looking at Mikko Rantanen’s pace through 20 games and assuming he will score 130 points seems a bit ridiculous now (he is currently on pace for just over 100), the fact is that a 20 game sample size for teams as a whole is often very predictive of whether or not they will ultimately make the playoffs. In fact, over the past 5 seasons, 77.5% of teams that found themselves in a playoff position at American Thanksgiving went on to make the playoffs.

Given the high predictability of holding a playoff spot at Thanksgiving, I believed that when other statistics are analyzed, they are likely to provide an even greater ability to predict which teams are playoff teams given various statistics collected at American Thanksgiving each year.
With the help of machine learning, I hoped to be able to create a model to out predict the strategy of picking current playoff teams.
Process Used
In creating a machine learning model, I wanted to be able to classify whether a team could be best classified as a playoff team or not, given a variety of statistics collected on Thanksgiving. To do so, I used Logistic Regression within machine learning in order to classify and group variables as binary, 1 being a playoff team, and 0 being a non-playoff team. Through examining the past 11 years of team data from Thanksgiving (minus the lockout shortened season for obvious reasons) and classifying each team, I hoped to train my model to be able to accurately classify playoff teams.
Within python I used the numpy, pandas, pickle, and various features within sklearn including RFE (Recursive Feature Elimination) and Logistic Regression packages to create the model. Pandas was used to import and read spreadsheets from within excel. Pickle was used to save my finalized model. Numpy was used in certain fit calculations. RFE was used to eliminate features and assign coefficients to the impact criteria was having on the decision of whether a team made the playoffs. Finally, Logistic Regression was used to assign a predicted shape to the model.
Criteria Valuation
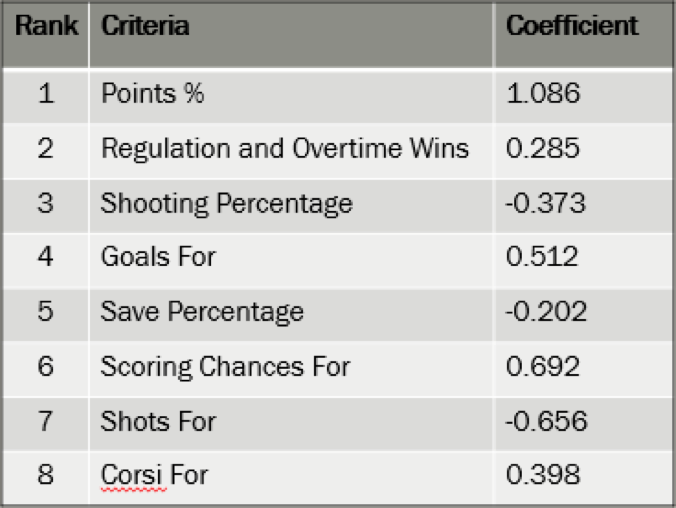
Starting off with all statistics I could collect for teams at Thanksgiving, I began to weed out less predictive variables until I landed on a group of 8. Using Recursive Feature Elimination (RFE), I was able to continually run the model and see which variables were deemed most predictive and should be included in the model. The factors as listed below were deemed most predictive, in order of importance
to the model.
While point percentage is the most predictive, other statistics like shooting percentage, save percentage, or goals for percentage provide a bigger picture perspective that allows for a better predictive capability for the machine learning model.
It has been determined that having higher shots for, shooting percentage, and save percentage all have a negative effect on whether or not you end up making the playoffs. For shooting percentage and save percentage, this is likely due to the fact that the model has identified a PDO like correlation in which teams with a lower save percentage and shooting percentage can be classified as “unlucky” and will eventually regress towards the norm. Additionally, the number of shots a team takes relative to the other team has a negative correlation with making the playoffs. This could be due to score effects that cause losing teams to typically generate more shots that are of lower quality. As the model shows, it is primarily high danger chances that are predictive of making the playoffs, not just any shot.
The Results

Running the model, 81.25% or 13 out of 16 playoff teams in a playoff spot as of March 1stwere correctly classified as playoff teams. Furthermore, an additional 2 teams (Columbus and Colorado) sat only 1 point back of a playoff spot. In contrast, picking the playoff teams at Thanksgiving would only result in a 68.75% success rate or 11 out of 16 teams. Furthermore, 3 teams that were in a playoff position at Thanksgiving are no longer in the playoff race in comparison to only 1 team (Buffalo) predicted by the model.
Outliers
Particularly interesting decisions made by the machine learning model include the decision to not pick the Rangers to make the playoffs, despite leading the Metro at Thanksgiving, and the choice to select Vegas to make the playoffs despite a slow start.
One reason behind this choice could have been New York’s low number of ROW. With a mere 8 ROW in 22 games, the New York Rangers sat atop the Metropolitan Division mainly in part to their 4-0 record in shootouts. Seeing that the New York Rangers were playing so many close games, the model likely discounted the strength of the Rangers. Additionally, the New York Rangers had the 4thlowest corsi for %, 6thlowest shots for %, 9thlowest scoring chance for %. As for points for %, the Rangers were ranked at an underwhelming 13th in the league, but led the Metro since the Metro was a weak division and the Rangers had more games played. Given the Rangers low valuation across all these supporting criteria, the machine predicted that they would not make the playoffs despite their stronger points for % at Thanksgiving.
As for the Golden Knights, despite holding the 29thbest point % in the league, Vegas was among the top 4 in the league in shots for %, corsi for % and scoring chances for %. Additionally, Vegas had the league’s lowest PDO (SH% + SV%) at 95.66. Given all these things considered, the model likely believed it was only a matter of time before the Vegas Golden Knights began winning.
Flaws in the Model
While my machine learning model appears to have the ability to out predict the strategy of picking all playoff teams at Thanksgiving, two main limitations of the model as highlighted above is the inability of the machine to pick teams based on the given playoff format, and the lack of data at various game states.
Unaware of the NHL’s current playoff format, the model picked 9 Eastern Conference teams, and only 7 Western Conference teams. Without a grasp on the alignment of divisions within the league, the model is at a disadvantage when picking teams, particularly when specific divisions or conferences are more “stacked” than others. Therefore, there is the potential of the model picking an otherwise impossible selection of teams to make the playoffs.
Furthermore, data collected to be fed into the model was only even-strength data. While this provides a decent picture of a team’s capability, certain teams that rely on their power play, as the Penguins traditionally have, may be disadvantaged and discounted. Finding a way to incorporate this data into the model would likely provide a fuller picture and a more accurate prediction.
Final Thoughts
While the model I have created is by no means perfect, it provides a unique perspective into not only the importance of the first 20 or so games of the season, but also what statistics beyond wins are important in attempting to classify a playoff team. While the model appears to out predict the strategy of selecting all playoff teams at Thanksgiving, it will be interesting to see in years to come if there is a continued ability to classify playoff teams given Thanksgiving stats.
Statistics retrieved from Natural StatTrick
Keep up to date with the Queen's Sports Analytics Organization. Like us on Facebook. Follow us on Twitter. For any questions or if you want to get in contact with us, email qsao@clubs.queensu.ca, or send us a message on Facebook.