
Since the 2009 introduction of pitch tracking boxes such as FoxTrax airing on MLB broadcasts, umpires have been under the microscope. In the past, bad umpire calls were chalked up as “part of the game” and brought a seemingly needed “human element” to a game that has since been dominated by numbers. However, nowadays, perfection is the expectation. Manager challenges and replay reviews have removed -- but also corrected -- the influence that field umpires have on the game.
Now that fans, team personnel, and even players have become equipped with the tracking technology to instantly prove home plate umpires wrong, why should we draw the line at determining balls and strikes? After all, there is a huge difference between a ball and a called strike when the count is full at 3-2.
This article is meant to explore a world where umpire judgment doesn’t play a factor in the outcome of the game and to see what this would mean for players as they can both benefit and suffer from bad calls. With that being said, there is no right answer and as far as we know, pitch tracking is not and will likely never be 100% accurate.
If you have made it this far and still don’t think this idea is at least worth considering, I highly recommend you watch this video:
How Can You Quantify Bad Calls?
Run Value (RV)
In order to assign a number to bad umpire calls, the full situation at the time of the call must be taken into consideration as not all bad calls are alike. A missed strike with nobody on base is easier to swallow than a missed strike with the bases loaded and a full count. To account for this, it is best to use the stat “run value.” Baseball Savant’s definition of run value is: “the run impact of an event based on the runners on base, outs, ball and strike count.” In this case, we will basically use run value to measure the expected run cost/gain of an umpire’s mistake.
Run Value Matrix
Now that we know what run value measures, we can use it to create a run value matrix. The goal of this is to predict how many runs should be scored given the current game situation.
The first step is to create a strike-ball matrix to determine the expected run value of a strike or ball called by the umpire given the count at the time of the pitch. Using weighted on-base average (wOBA), we can find the average outcome of every at-bat that features a given count. For example, an at-bat featuring an 0-2 count in 2020 (seen below) had a wOBA of .203 whereas an at-bat featuring a 3-0 count had a wOBA of .561.
Once we have calculated that for every possible count, we can determine the change in run value caused by an umpire’s call. In 2020, a called strike with a 3-2 count decreases the batting team’s expected run value by .371, as the batter would be struck out. If that same pitch were to be called a ball, their run value would increase by .328, as the batter would walk and go to first base. If we take the difference between the two outcomes, we get .699 which is then adjusted by the 2020 wOBA scale to put the value of each year on an even playing field.

Data retrieved via Baseball Savant
This process is then repeated for every number of outs and runners on-base scenario and is then merged into one run value number for each situation. For this project, I’ll use Baseball Savant’s run value metric.
Which Batters Received the Worst Umpiring in 2021?

Just as everyone expected, the batter that umpires teamed up against the most was Ross “Chicken Strip” Stripling of the Toronto Blue Jays. Whether umpires feared him showing up opposing pitchers with his career .088 batting average, or jealousy of his Wall Street-esque side hustle, umpires caused Ross to lose the most run value per pitch among batters who saw 20+ pitches in 2021. All jokes aside, this is a good indication that a sample size large enough to exclude pitchers from the rankings should be used. For this section, a minimum of 1000 pitches faced was set.

Using the column delta_run_exp, which is the sum of each player’s lost/gained run expectancy from missed strike/ball calls throughout the season, Yordan Alvarez of the Houston Astros was negatively impacted the most in 2021. Yordan would be expected to contribute 5.427 more runs during the season had the right calls been made at the plate. Although it may not seem like much, those runs could easily be the difference between winning and losing an extra game or two.
The lowest wRC+ generated by any of these batters was Josh Rojas’ 102 (he created 2% more runs than the league average hitter who would have a value of 100) so they are all good hitters who would likely have fewer strikeouts with an automated strike zone. Also on the list is Yordan’s Houston teammate, Carlos Correa. With two Astros in the top 3, I decided to look at 2021’s numbers on a team scale.

Now, I am no conspiracy theorist, but it certainly looks like the Astros were in the umpires’ bad books this year. Whether this was planned by the MLB’s head office, karma, or just simply a coincidence, Houston’s batters did get somewhat punished in 2021 for their sign-stealing scandal. Next up, I wanted to take a look at run value over the last 3 seasons.
Who Has Lost the Most RV Since 2019?

This list has some familiar faces on it (literally) as Robbie Grossman and Aaron Judge were both in the top-6 during 2021. One might wonder if Judge – who is known for his 6’7” height – may have a larger perceived strike zone than smaller players and is getting more bad calls against him as a result. To find out if there is anything behind this theory, I crunched some numbers.

I took every player who had received a minimum of 100 bad calls over the past 3 seasons and compared their total run value lost/gained to the height of their strike zone (defined on the graph as Player Height). Statcast’s sv_top metric measures the distance from the top of each player’s strike zone to the ground and is useful in this case as a player’s batting stance can shrink their personal strike zone despite their official height staying the same.
This graph does not suggest that there is any significant relationship between lost run value and player height. In fact, the opposite may even be true. Judge’s appearance on the list may even be an outlier but there are not even qualified 6’7” players to compare him with. Pending further investigation, the keys to accumulating a lot of bad calls against appears to be a mixture of human error/bad luck (blind umpires), good plate discipline on borderline pitches (especially with 2-strikes), and elite catcher framing.
How Will the Game Change with an Automated Strike Zone?

Photo credited to: Mike Cassese/Reuters
Without a home plate umpire calling balls and strikes, many things would change. First, most batters would have more success . From 2019-21, there were 1139 MLB batters who received an incorrect strike/ball call from an umpire. Of those 1139 batters, only 158 have gained run value due to umpire calls (Jason Castro is 1st in run value gained at +2.512 runs). Many of these bad calls led to strikeouts that ended scoring threats and directly affected the outcome of games. With the MLB’s recent interest in increasing league-wide scoring, getting rid of umpire influence may have a significant impact.
Although an overall increase in offence is important, the biggest change would come in the evaluation of catcher defense. With balls and strikes being automated, it will no longer be possible for catchers to influence umpire decisions through pitch framing. Game-calling, blocking, and throwing out runners will be the new defensive metrics with the most importance for catchers which means that they can take a crouch and stance position to focus on blocking wild pitches rather than the one-knee stance normally used to focus on framing.
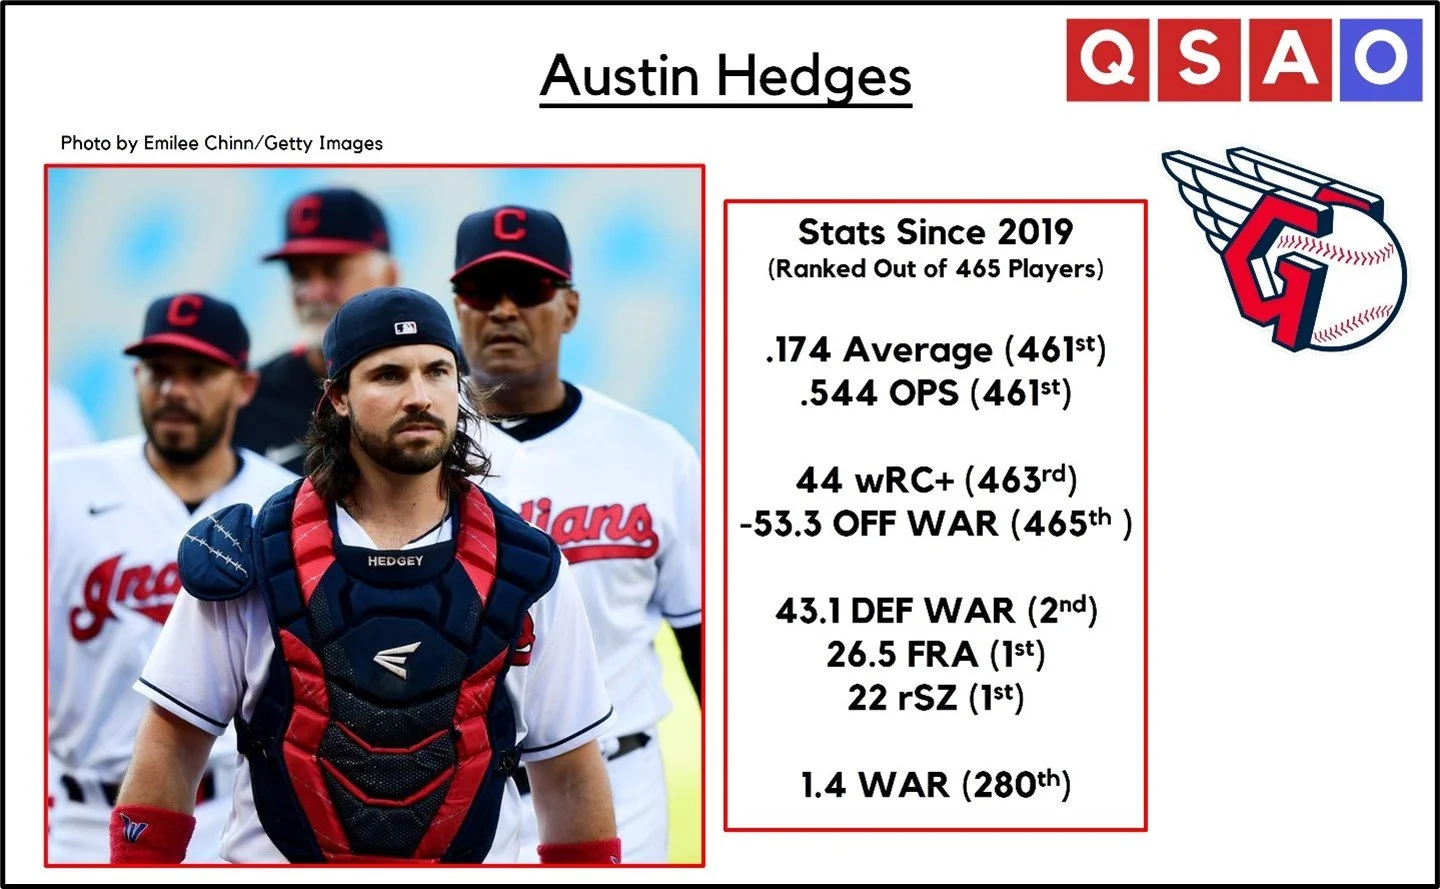
Austin Hedges, the Cleveland Guardians’ catcher, owns a league-worst offensive WAR of -53.3 since 2019 and a 44 wRC+ (tied for 2nd worst among batters with 300+ plate appearances). Chris Davis of the Baltimore Orioles, who was notorious for his horrible stretch of hitting in recent years, had a 48 wRC+ over that same span. However, Hedges has a +1.4 WAR compared to Davis’ -2.2 WAR, and he’s still set to be playing baseball in 2022, unlike Davis who is now retired.
So, what is the difference between them? Since 2019, no catcher in baseball has accumulated more Framing Runs or Strike Zone Runs Saved than Austin Hedges (per Fangraphs). This is a big reason why Hedges is still rostered despite his poor hitting track record. If defence-first catchers such as Hedges have their best traits removed, they will see a significant decrease in their value and will be phased out of the game as they fall below replacement-level.
Conclusion
In this article, we defined run value and how it can be used to quantify umpire calls. We saw that extremely tall players such as Aaron Judge are not at a significant strike zone disadvantage when it comes to bad calls. Additionally, the Houston Astros had the group of hitters most impacted by umpires in 2021- which may or may not be related to their sign-stealing scandal.
More often than not, bad umpire calls are taking potential runs off the board and it’s directly contributing to the death of offences across the MLB in an era where pitchers already have the upper hand. Unfortunately, defensive catchers may become an endangered species, but the game needs more offence anyways. Although umpires can make games more entertaining due to their personalities and the arguments they create, they have been negatively influencing games for too long.
4.1% of all pitches in 2021 (29236 pitches) would have been overturned had an automated strike zone been in place. We now have the technology to remove human error from the equation and the MLB should strongly consider it.
Sources: Fangraphs, Statcast Search - Baseball Savant
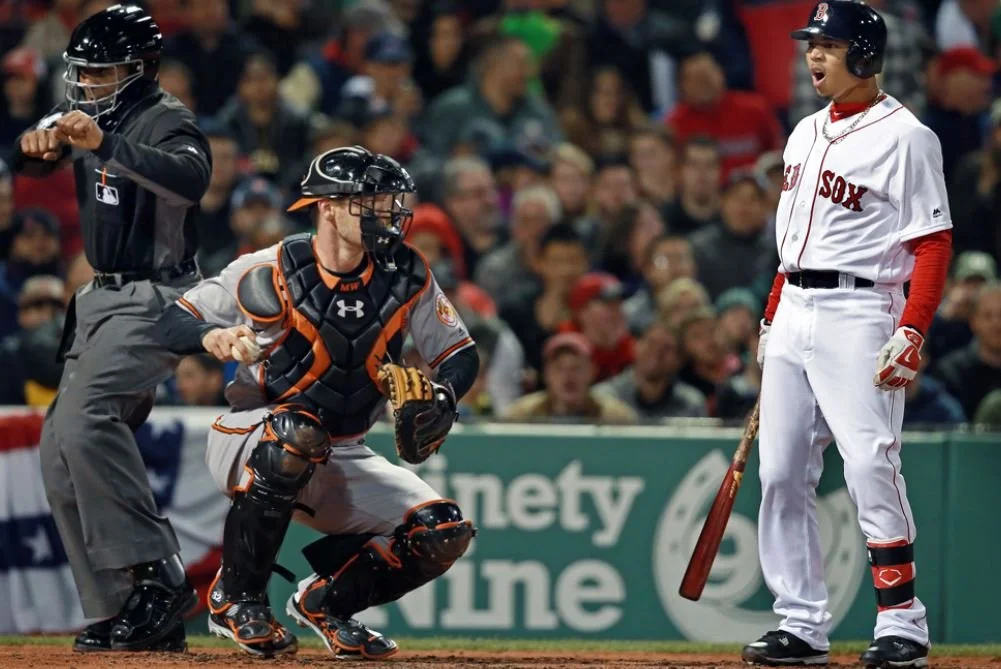
Featured Image via Jim Davis, Boston Globe